

Kinfinity Imaging
See inside rubber. Compound by compound
Conventional analysis gives you averages. Kinfinity Imaging gives you location: a precise spatial map of what sits inside a rubber sample, where it sits, and in what abundance.
Where it applies
Bulk analysis tells you a compound is present; it does not tell you whether it reached the part of the tyre that needs it.
What it lets you do
- Confirm a formulation is consistent batch to batch
- Verify incoming raw material matches specification
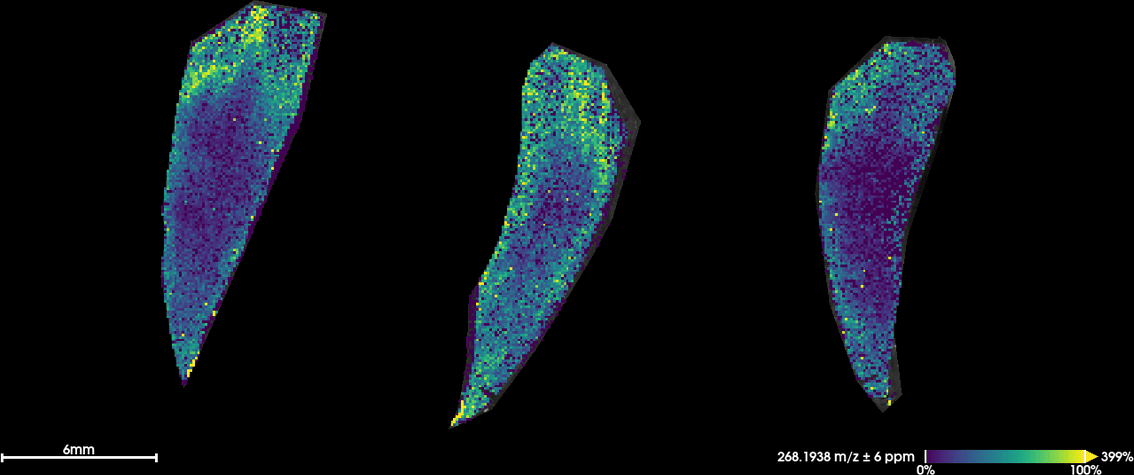
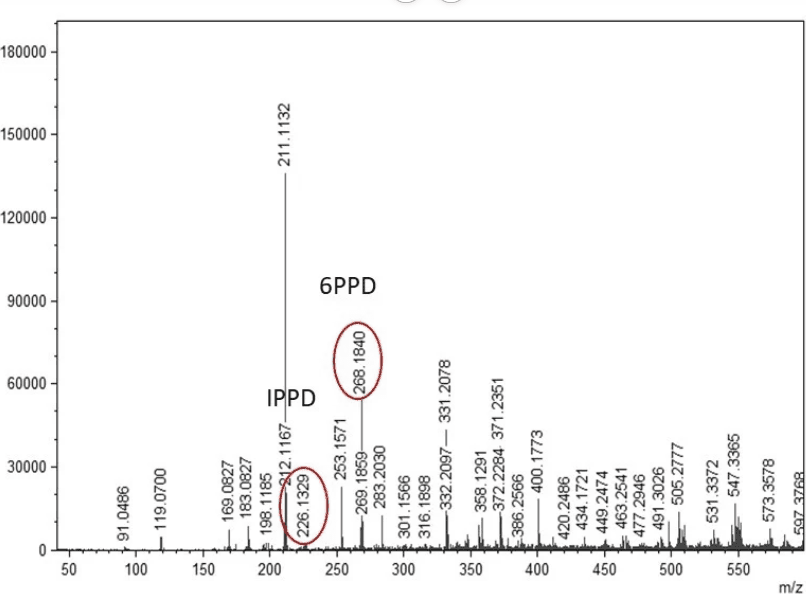
- See where protective compounds actually end up after curing
What it lets you do
- Characterise end-of-life tyre and rubber feedstocks precisely
- Identify material differences that affect end-product quality
- Understand where value can be recovered from mixed streams
Regulatory questions increasingly turn on where a substance sits and whether it migrates, not simply whether it is present in a sample at all.
What it lets you do
- Evidence compound distribution with spatial data
- Track migration behaviour before and after curing
- Support reporting with visual, reproducible results
How it works
From sample to spectrum
Four steps take a physical rubber sample to a molecular map you can read.
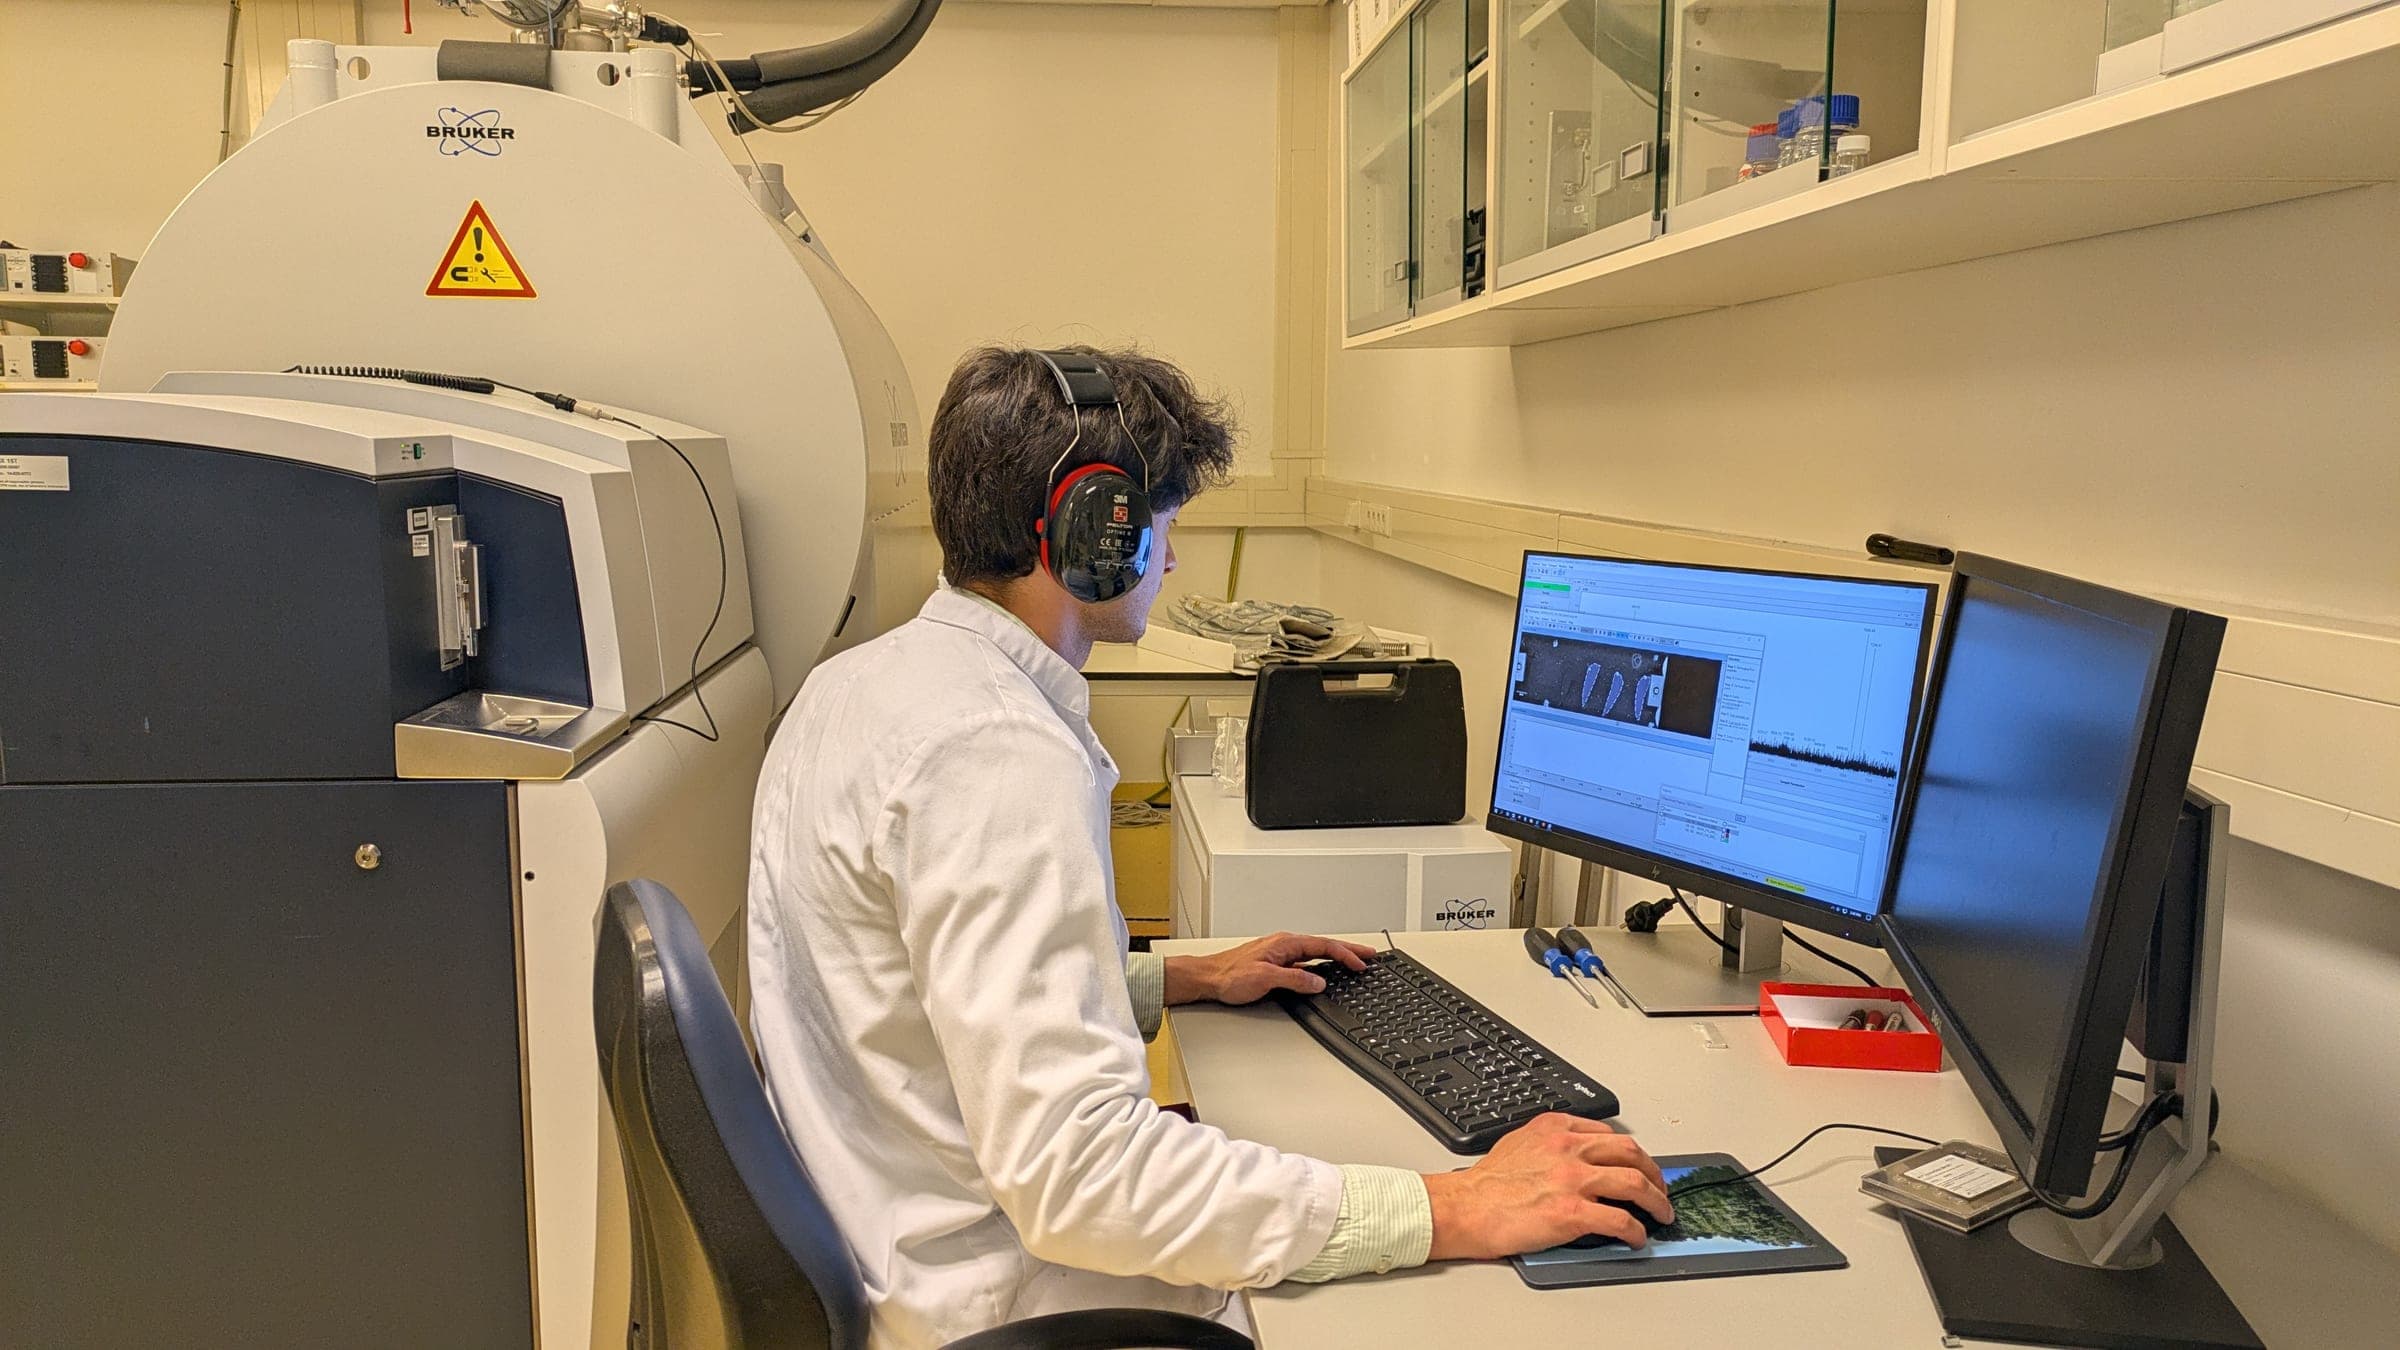
Sample cutting
What happens
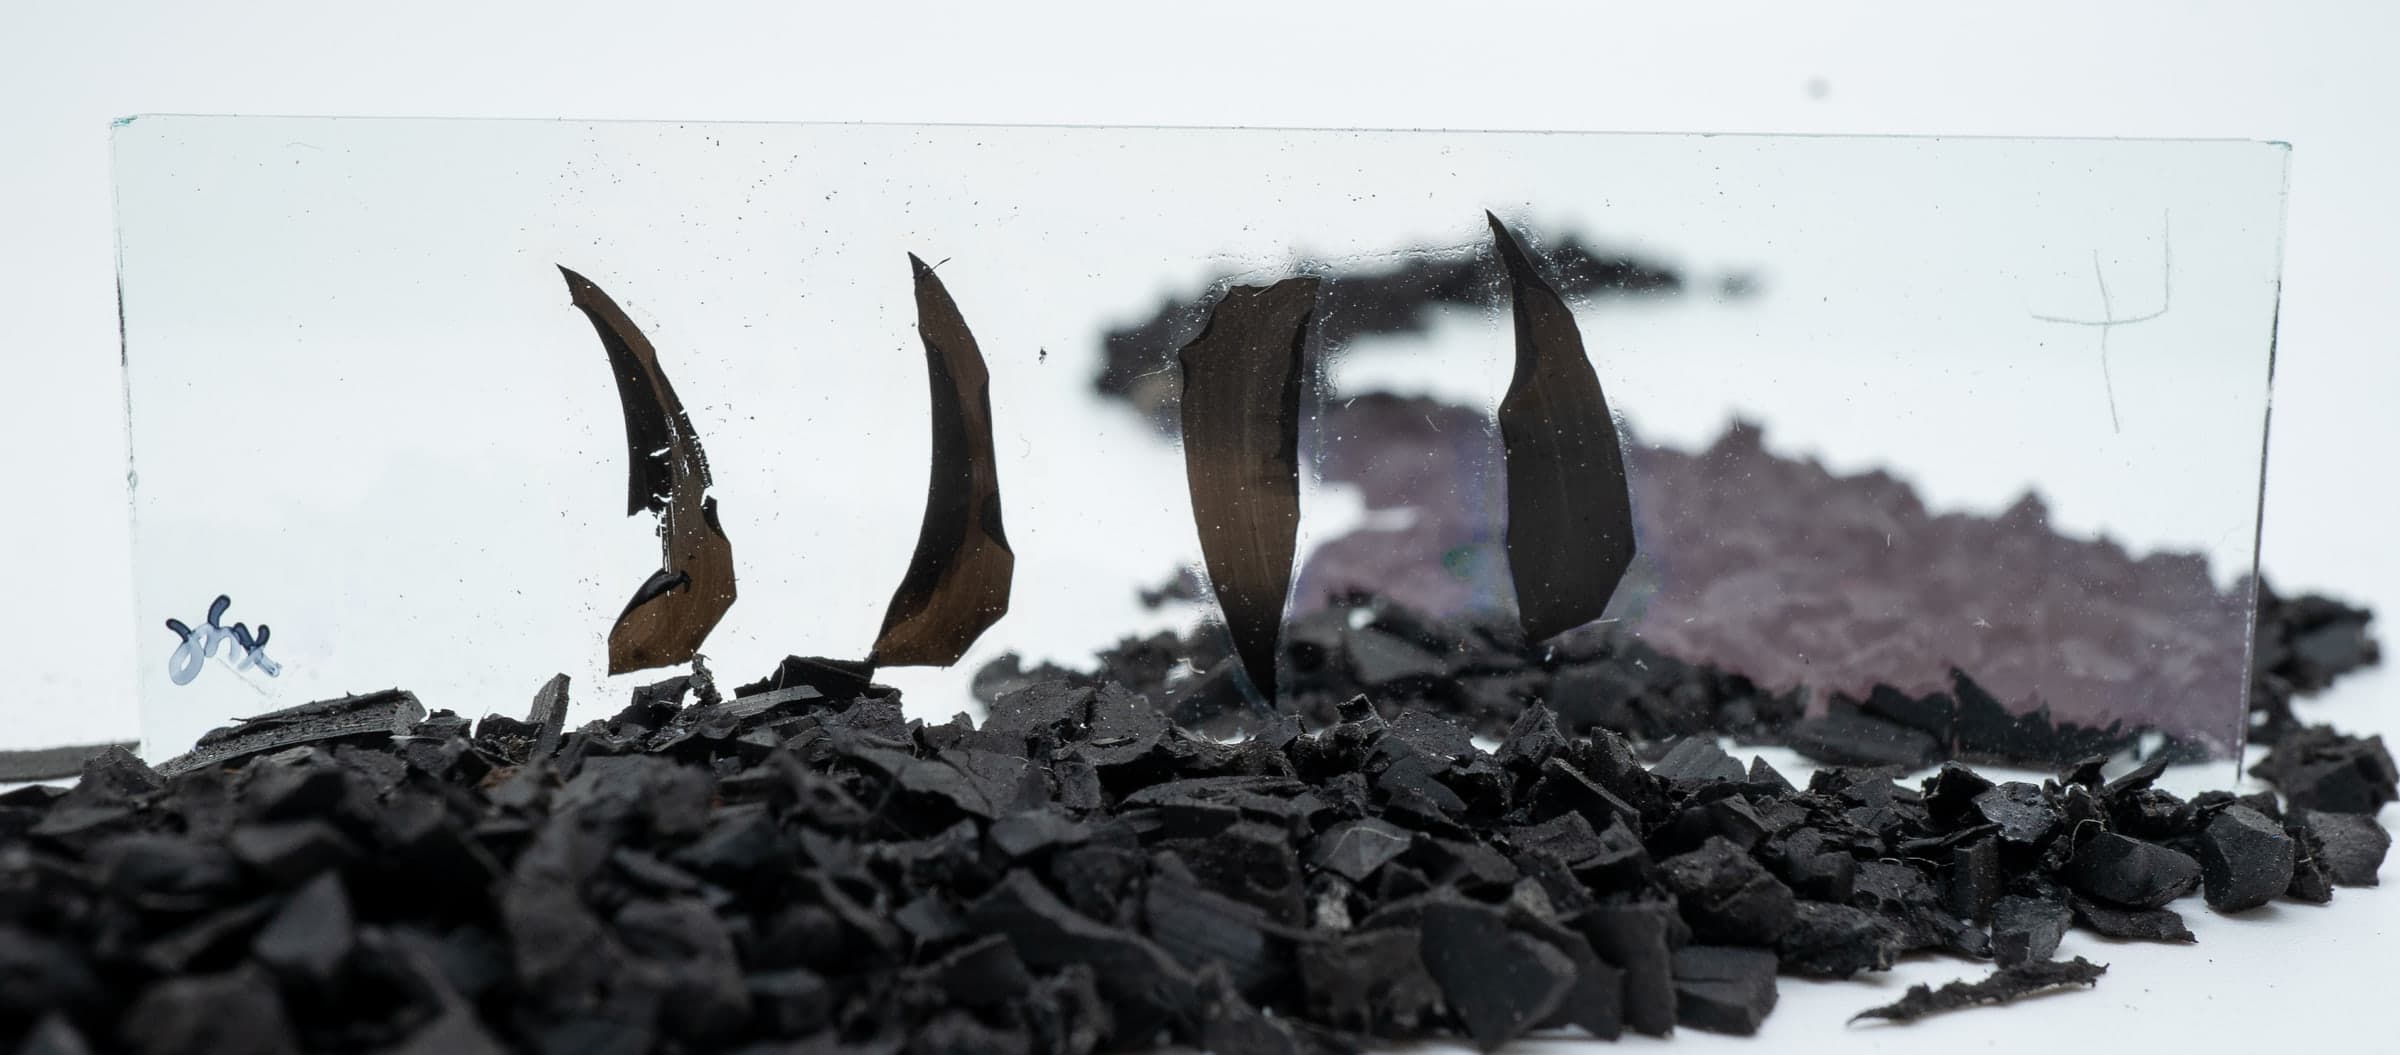
A thin, even section is cut from the rubber sample so the imaging surface is flat and representative.
Why it matters
Section quality sets the ceiling on spatial resolution downstream, so consistency matters more than speed here.
Use case examples in rubber
What we image, and what it tells you
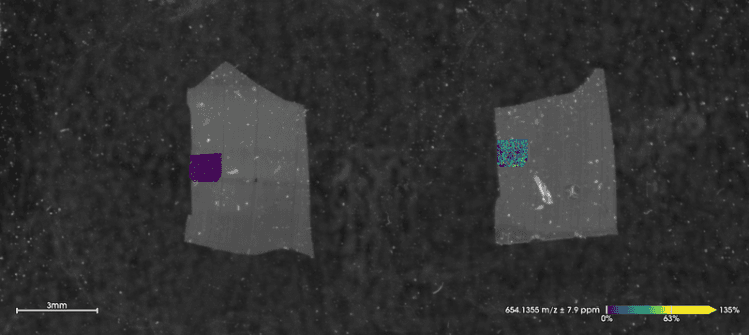
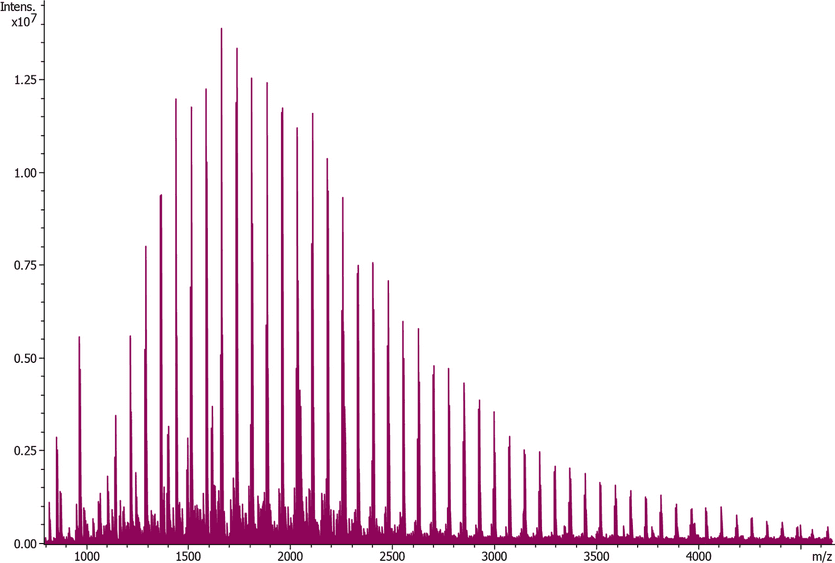
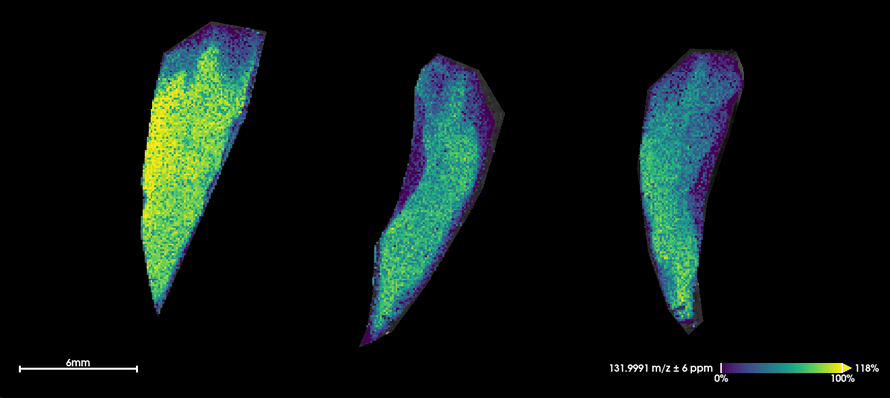
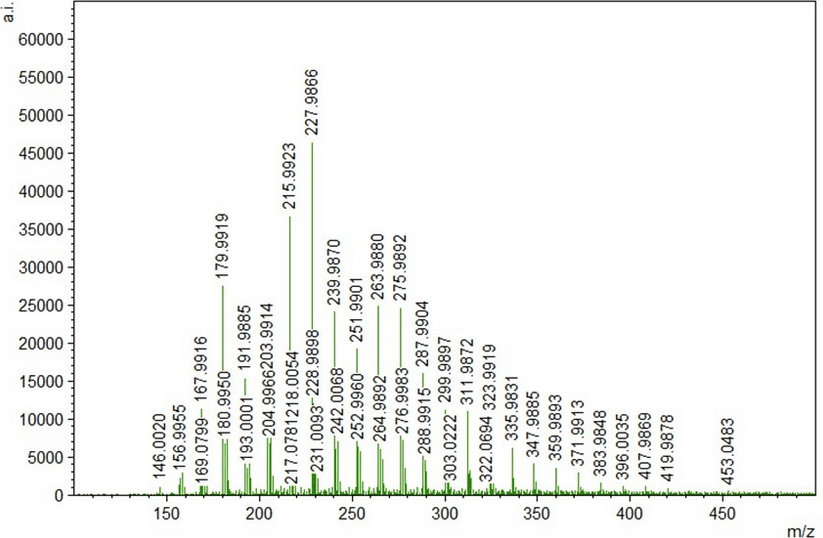
See exactly where each polymer type sits across a tyre or recycled section, map chain-length distribution spatially, and read repeating-unit patterns directly from the mass spectrum.
What it lets you do
- Confirm a formulation is consistent batch to batch
- Verify incoming raw material matches specification
- Pinpoint exactly where blending went wrong
This runs today, on your own samples.